This is fra.europa.eu, the official website of the European Union Agency for Fundamental Rights (FRA). It is managed by the web team in the Agency's Communication Department, and provides a wide range of information about the FRA's work, including its research and surveys, publications, events, co-operation activities and more.
In addition to this website, the FRA also maintains two online databases of fundamental rights-related information, which are:
- Charterpedia - a compilation of international, EU and national constitutional law structured around the Charter of Fundamental Rights
- Case law database - a comprehensive compilation of leading case law on discrimination on various grounds in the EU Member States
We have also developed a version of the Charterpedia specially for mobile devices such as tablets and smartphones. To access it, go to the following URL on your mobile device:
Technical requirements
This site uses modern web standards (HTML5 and CSS3) developed by the World Wide Web Consortium (W3C), the international body responsible for web-related standards. It is viewable in all modern browsers and mobile devices, and is designed to also work in older browsers, although the full functionality may not be available. If you are using an older browser and experience any difficulties with the site, you may wish to consider upgrading your browser.
Technical requirements for the FRA data visualization tool
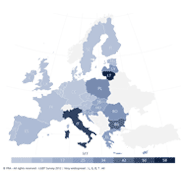
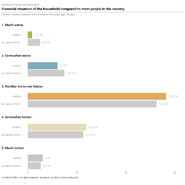
The FRA data visualization tool (see the visualization of the EU LGBT survey results here) is designed to work in all modern browsers such as Microsoft Internet Explorer 9+, as well as recent versions of Mozilla Firefox, Google Chrome, Apple Safari and Opera. If you are using an old browser such Internet Explorer 8 or earlier, we recommend that you either upgrade to version 9+ or use instead the latest version of one of the other browsers listed above.
Accessibility
We are committed to making this site as accessible as possible for all users, including those with disabilities. For more details, please see our accessibility section.
RSS feeds
We offer a number of RSS feeds where you can get the latest news on FRA publications, press releases, events, etc. For more details, please see the RSS section.
Language policy
We try to reach as broad an audience as possible by making our content available in multiple languages. This website is currently available in English and French, and German will be added soon. In addition, many of our publications, press releases and other content are available in other languages in PDF format. The FRA is committed to further developing its language policy according to the available resources.
Privacy and data protection
The Agency is committed to safeguarding the privacy of users of this website, while aiming to provide a personalised and valuable service. For more information, see the data protection statement.
Cookies – what are they?
To make this site function properly, we sometimes place small data files on your computer, known as cookies. Cookies help the site remember your settings – language, font size and other preferences for how you want to view the site on your computer - so you don’t have to keep re-entering them whenever you come back to us.
This website uses Piwik (http://www.piwik.org), an open source web analytics service. Piwik uses cookies to help to analyse the use of this site and to compile reports about website activity. This information will not be passed onto third parties. You have the option of setting of the Piwik deactivation cookie. This prevents your usage behaviour from being recorded. The cookie is called "Piwik_Ignore" and is set by clicking on the following link from this page: "Object to PIWIK use". This stores a cookie on your computer that tells us that we are not allowed to process your data. This lasts for two years. Note that your objection only remains valid for as long as you have this cookie stored on your system.
Our cookies are not used to identify you personally. They’re just there to make the site work better for you.
How you can control cookies
You can control and/or delete cookies as you wish – for details, see AboutCookies.org.
You can delete all the cookies already on your computer and you can set most browsers to block them being placed. But if you do this, you may have to manually adjust some preferences every time you visit the site. The Agency does not use cookies for any other purpose than those presented here and does not use them to collect any personal data for any other purpose.
"Do not track" option
Piwik also respects the “Do not track” option that can be set on modern browsers. If you have this option enabled, your usage of this site will not be tracked.
Documents
Please be informed that all non-official documents produced by the EUMC (EU Monitoring Centre on Racism and Xenophobia, which was the predecessor organisation of the FRA), such as working documents (including "working definitions") and conference papers have been archived and are no longer available on the FRA website. The official EUMC documents such as annual reports and thematic reports are, however, still available on the website of FRA.
