EU Survey on Immigrants and Descendants of Immigrants (EU-MIDIS III)
Different visualisation tools
This interactive tool offers different ways to explore the data behind the survey results. There are three main visualisation options: Bar chart, Country detail and Countries comparison, as well as a Table option that shows the data for the selected visualisation.
Bar chart
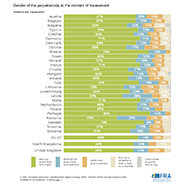
The Bar chart visualisation illustrates the results for covered EU Member States, Albania, North Macedonia and Serbia, the EU-10 Total (covered EU Member States) and Total (all covered countries) as a vertical stacked bar chart with all answer categories.
Country detail
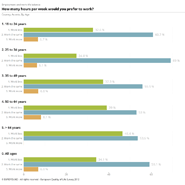
The Country detail visualisation presents the values for all answer categories for the selected country, survey question and subset of respondents.
Countries comparison
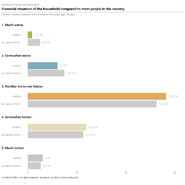
The Countries comparison visualisation presents a comparative overview of the results for at least two selected countries. Country results can also be compared with the EU-10 Total (covered EU Member States) or Total (all survey countries) across answer categories.
Data table
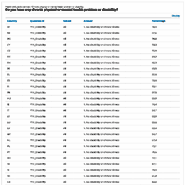
The Table presents the data of the selected visualisation in a numerical format.
How to explore the data
The survey questions are divided into six topics and each topic has a number of questions. Choose a topic, then a question from the drop-down list in the grey box. You can also apply additional filters. You can also change the visualisation using the list of options on the right hand side of the chart or map.
How to export the data
The export options can be accessed via the Export button. To export the visualisation as an image, choose one of Figure (PNG), FSVG (High resolution), EPS (High resolution) or PDF (High resolution). To export the data for the selected visualisation in Microsoft Excel format, choose XLSX. To generate a Page URL or Embeddable HTML choose the corresponding option.
The survey is based on responses from 16,124 individuals in 15 Member States: Austria, Belgium, Denmark, Finland, France, Germany, Greece, Ireland, Italy, Luxembourg, the Netherlands, Poland, Portugal, Spain and Sweden. Survey respondents originate from four target groups:
- North Africa in Belgium, France, Italy, the Netherlands and Spain.
- African countries south of the Sahara in Austria, Belgium, Denmark, Finland, France, Germany, Ireland, Italy, Luxembourg, Poland, Portugal, Spain and Sweden.
- Syria in Austria, Denmark, Germany, Greece, the Netherlands and Sweden.
- Türkiye in Austria, Denmark, Germany and the Netherlands.
One, two or three target groups were surveyed in each survey country.
For the purposes of the survey, respondents included the following:
- ‘Immigrants’ include people who were not born in a Member State, a European Economic Area (EEA) country or a European Free Trade Association (EFTA) country or the UK, whose usual place of residence was in the territory of the Member State where the survey was conducted.
- ‘Descendants of immigrants’ are people who were born in a Member State or EEA/EFTA country or the UK, whose usual place of residence was in the territory of the Member State where the survey was conducted and who had at least one parent not born in an EU or EEA/EFTA country or the United Kingdom.
Respondents were at least 16 years old, had resided in the country for at least 12 months and lived in private households. The fieldwork took place from October 2021 to late September 2022.
The survey questionnaire was translated into 17 languages.
The survey contains questions on perceived discrimination on different grounds (skin colour, ethnic or immigrant background, religion or religious beliefs, age, sex/gender, disability, sexual orientation, gender identity or gender expression) in different settings, such as employment, education, housing, health and when using public or private services. It also covers police stops, criminal victimisation (including hate crime) as well as awareness of rights and where to go for help. In addition, respondents were asked about societal participation and integration, including trust in public institutions and level of attachment to the country of residence, political participation. The survey collected information about socioeconomic situations and living conditions of the respondents and their households.
Based on the survey data, the following reports were published:
Being Black in the EU (2023)
Being Muslim in the EU (2024)
Technical and Quality Report - EU Survey on Immigrants and Descendants of Immigrants (2024)
The FRA data visualization tool is designed to work in all modern browsers such as Google Chrome, Apple Safari, Mozilla's Firefox and Microsoft Edge. If you are using an old browser such Internet Explorer 11 or earlier, we recommend that you either upgrade to Edge or use instead the latest version of one of the other browsers listed above.
Accessibility
We are committed to making this site as accessible as possible for all users, including those with disabilities. For more details, please see our accessibility section.