Roma survey 2021
Different visualisation tools
This interactive tool offers different ways to explore the data behind the survey results. There are four main visualisation options: Map, Bar chart, Country detail and Countries comparison, as well as a Table option that shows the data for the selected visualisation.
Map
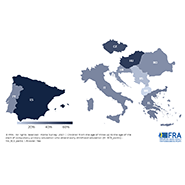
The map visualisation presents an overview of the results for covered EU Member States as well as North Macedonia, Serbia, the EU-8 Total (covered EU Member States) and Total (all covered countries) for individual answer category selected by the user.
Bar chart
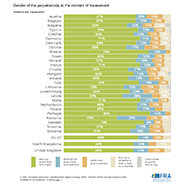
The Bar chart visualisation illustrates the results for covered EU Member States, North Macedonia, Serbia, the EU-8 Total (covered EU Member States) and Total (all covered countries) as a vertical stacked bar chart with all answer categories.
Country detail
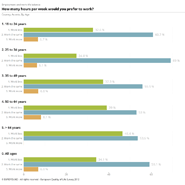
The Country detail visualisation presents the values for all answer categories for the selected country, survey question and subset of respondents.
Countries comparison
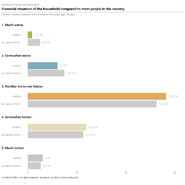
The Countries comparison visualisation presents a comparative overview of the results for at least two selected countries. Country results can also be compared with the EU-8 Total (covered EU Member States) or Total (all survey countries) across answer categories.
Data table
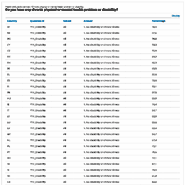
The Table presents the data of the selected visualisation in a numerical format.
How to explore the data
The survey questions are divided into six topics and each topic has a number of questions. Choose a topic, then a question from the drop-down list in the grey box. You can also apply additional filters. You can also change the visualisation using the list of options on the right hand side of the chart or map.
How to export the data
The export options can be accessed via the Export button. To export the visualisation as an image, choose one of Figure (PNG), FSVG (High resolution), EPS (High resolution) or PDF (High resolution). To export the data for the selected visualisation in Microsoft Excel format, choose XLSX. To generate a Page URL or Embeddable HTML choose the corresponding option.
FRA’s 2021 survey on Roma in Croatia, Czechia, Greece, Hungary, Italy, North Macedonia, Portugal, Romania, Serbia and Spain collected information from 8,461 respondents living in private households who self-identify as Roma, are 16 or older and have lived in the survey countries for at least the 12 months before the survey. In addition, information was collected on 20,212 people living in the survey respondents’ households and on the infrastructure of their neighbourhoods. The fieldwork took place from February until August 2021 through face-to-face interviews, with trained interviewers using a computerised questionnaire.
The survey aimed to provide data that can serve as a baseline for the EU Roma framework’s headline and secondary indicators included in the portfolio of indicators. These indicators are marked in the visualization with ‘H’ (headline indicator) or ‘S’ (secondary indicator) in the title of question and in the Notes under the graphics of a given question. The survey aligns with previous surveys (Second EU Minorities and Discrimination Survey (2016) and the Roma and Travellers Survey (2018-2019)), which allows for analysing trends in key indicators. This should help Member States to develop more targeted measures in their national Roma frameworks and to assess the achievement of their objectives. The survey further refines research methodologies for sampling and surveying hard-to-reach or elusive populations. These methodologies are shared with the Member States. The 2021 Council recommendation on Roma equality, inclusion and participation envisages FRA or individual Member States repeating the Roma Survey in 2024 and 2028 to provide the data necessary for mid- and end-term results assessment.
The Roma survey 2021 results are published in Roma in 10 European countries – Main results: Roma survey 2021. The questionnaire and technical information on how the survey was done are publicly available as well.
The FRA data visualization tool is designed to work in all modern browsers such as Google Chrome, Apple Safari, Mozilla's Firefox and Microsoft Edge. If you are using an old browser such Internet Explorer 11 or earlier, we recommend that you either upgrade to Edge or use instead the latest version of one of the other browsers listed above.
Accessibility
We are committed to making this site as accessible as possible for all users, including those with disabilities. For more details, please see our accessibility section.