LGBTI Survey Data Explorer
Different visualisation tools
This interactive tool offers different ways to explore the data behind the survey results. There are four main visualisation options: Map, Bar chart, Country detail and Country comparison, as well as a Data table option that shows the data for the selected visualisation.
EU map
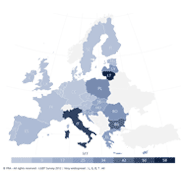
The map visualisation presents an overview of the results for EU-28 as well as North Macedonia and Serbia.
EU bar chart
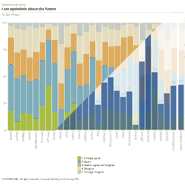
The EU bar chart visualisation illustrates the results for all EU Member States, North Macedonia, Serbia and the EU-28 average as a vertical stacked bar chart.
Country detail
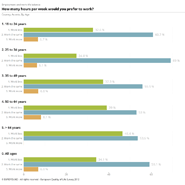
The country detail visualisation presents the values for all answer categories for the selected country, survey question and subset of respondents. The horizontal bar charts include the EU-28 average.
Country comparison
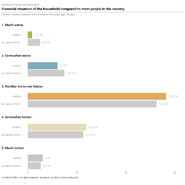
The country comparison visualisation presents a comparative overview of the results for two selected countries. Country results can also be compared with the EU-28 average across answer categories
Data table
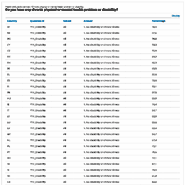
The data table presents the data of the selected visualisation in a numerical format.
How to explore the data
The survey questions are divided into eight topics and each topic has a number of questions. Choose a topic, then a question from the drop-down list in the gray box, and the target group. You can also apply additional filters. Survey results can be filtered by respondents’ age, gender and between first- and second-generation immigrants. You can also change the visualisation using the list of options on the right hand side of the chart or map.
How to export the data
The export options can be accessed via the Export button. To export the visualisation as an image, choose one of Figure (PNG), Figure (High resolution), EPS (High resolution) or PDF (High resolution). To export the data for the selected visualisation in Microsoft Excel format, choose Data (XLS). To generate a Page URL, Embeddable HTML or a Page citation, choose the corresponding option.
The EU-28 aggregate includes the United Kingdom (UK) because the reference period of the data collection is from when the UK was a Member State.
A total of 139,799 persons aged 15 years or older who describe themselves as lesbian, gay, bisexual, trans or intersex (LGBTI) completed the online EU-LGBTI II Survey in all EU Member States and the candidate countries of North Macedonia and Serbia.
The survey was conducted online3 from 27 May to 22 July 2019. Its questionnaire covered a wide range of issues, such as experiences with discrimination, harassment or violence, rights awareness, openness about being LGBTI, positive and negative experiences at work and in education, socio-economic and living conditions, health and well-being, and housing issues.
The findings are based on data weighted to take into account differences in the estimated size of each LGBTI group in each survey country and by age group, based on information on the LGBTI population from previous LGBTI surveys in the EU. In addition, the data were weighted taking into account the respondents’ affiliation with LGBTI organisations and whether they have participated in other LGBTI surveys (including FRA’s LGBT survey of 2012). This was done to correct for possible over-representation of respondents closely affiliated with LGBTI organisations and with a higher propensity to participate in LGBTI surveys.
The FRA data visualization tool is designed to work in all modern browsers such as Microsoft Internet Explorer 9+, as well as recent versions of Mozilla Firefox, Google Chrome and Apple Safari. If you are using an old browser such Internet Explorer 8 or earlier, we recommend that you either upgrade to version 9+ or use instead the latest version of one of the other browsers listed above.
Accessibility
We are committed to making this site as accessible as possible for all users, including those with disabilities. For more details, please see our accessibility section.
About this survey
Second European Union Minorities and Discrimination Survey